Images
Here you can find an overview of the figures reported in my papers. The figures refer to experiments and simulations of convection in porous media, fibre-laden flows, droplets transport.
Movies
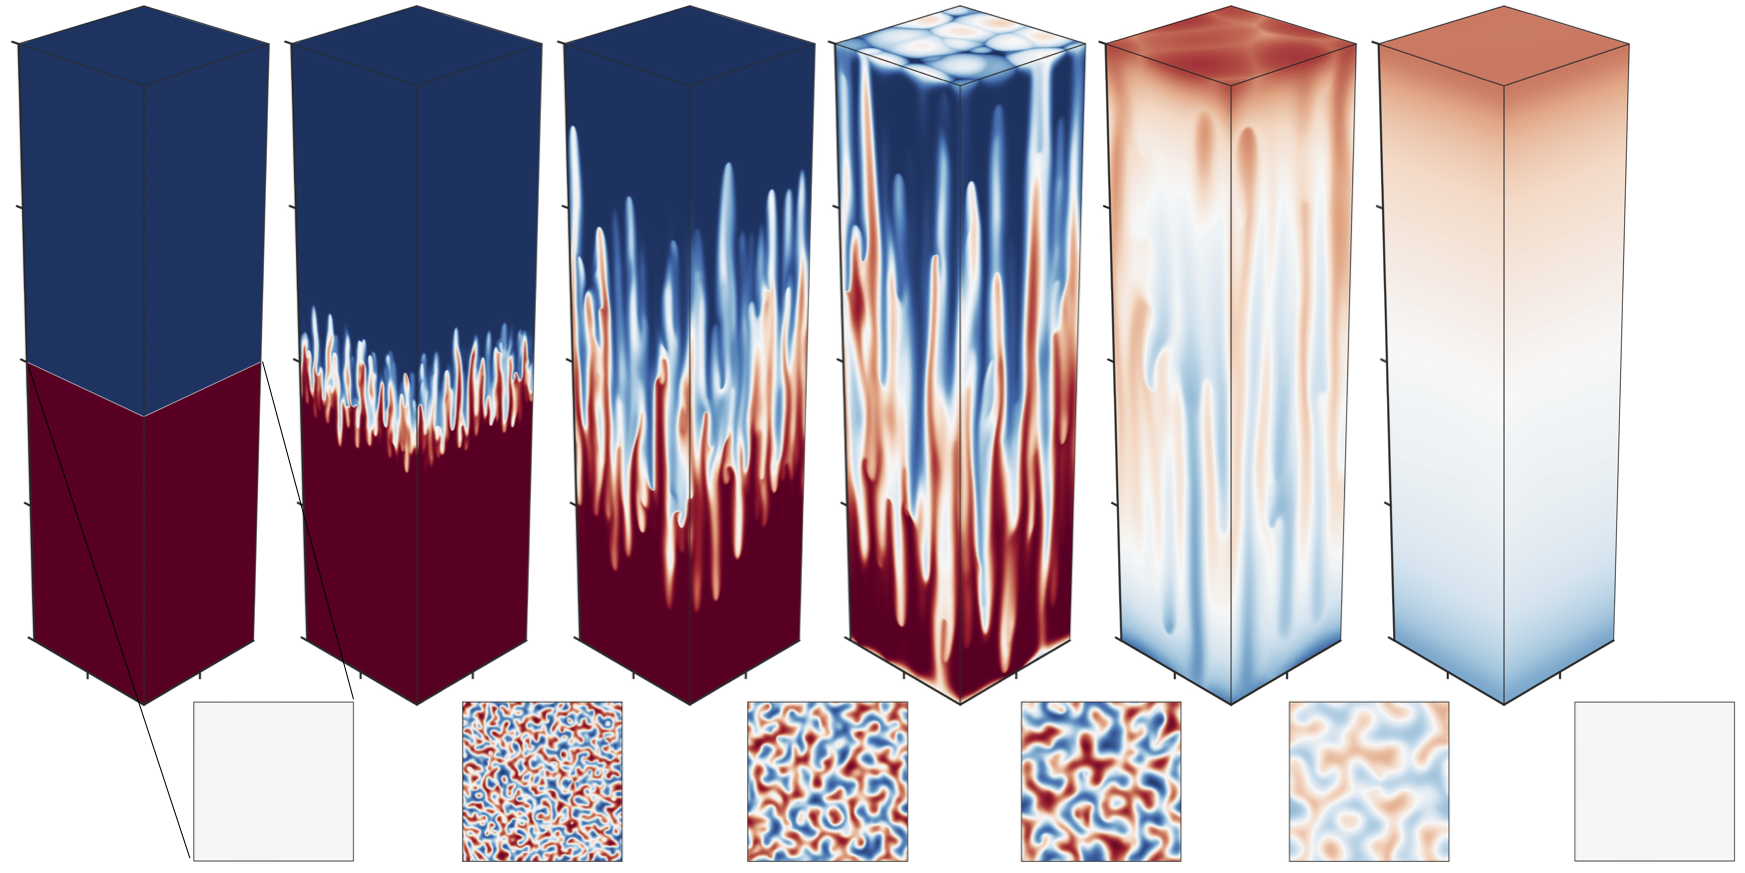
3D Darcy flow at Ra = 2,500
3D simulation of Rayleigh-Darcy convection (Zhu et al., JFM , 2024 )
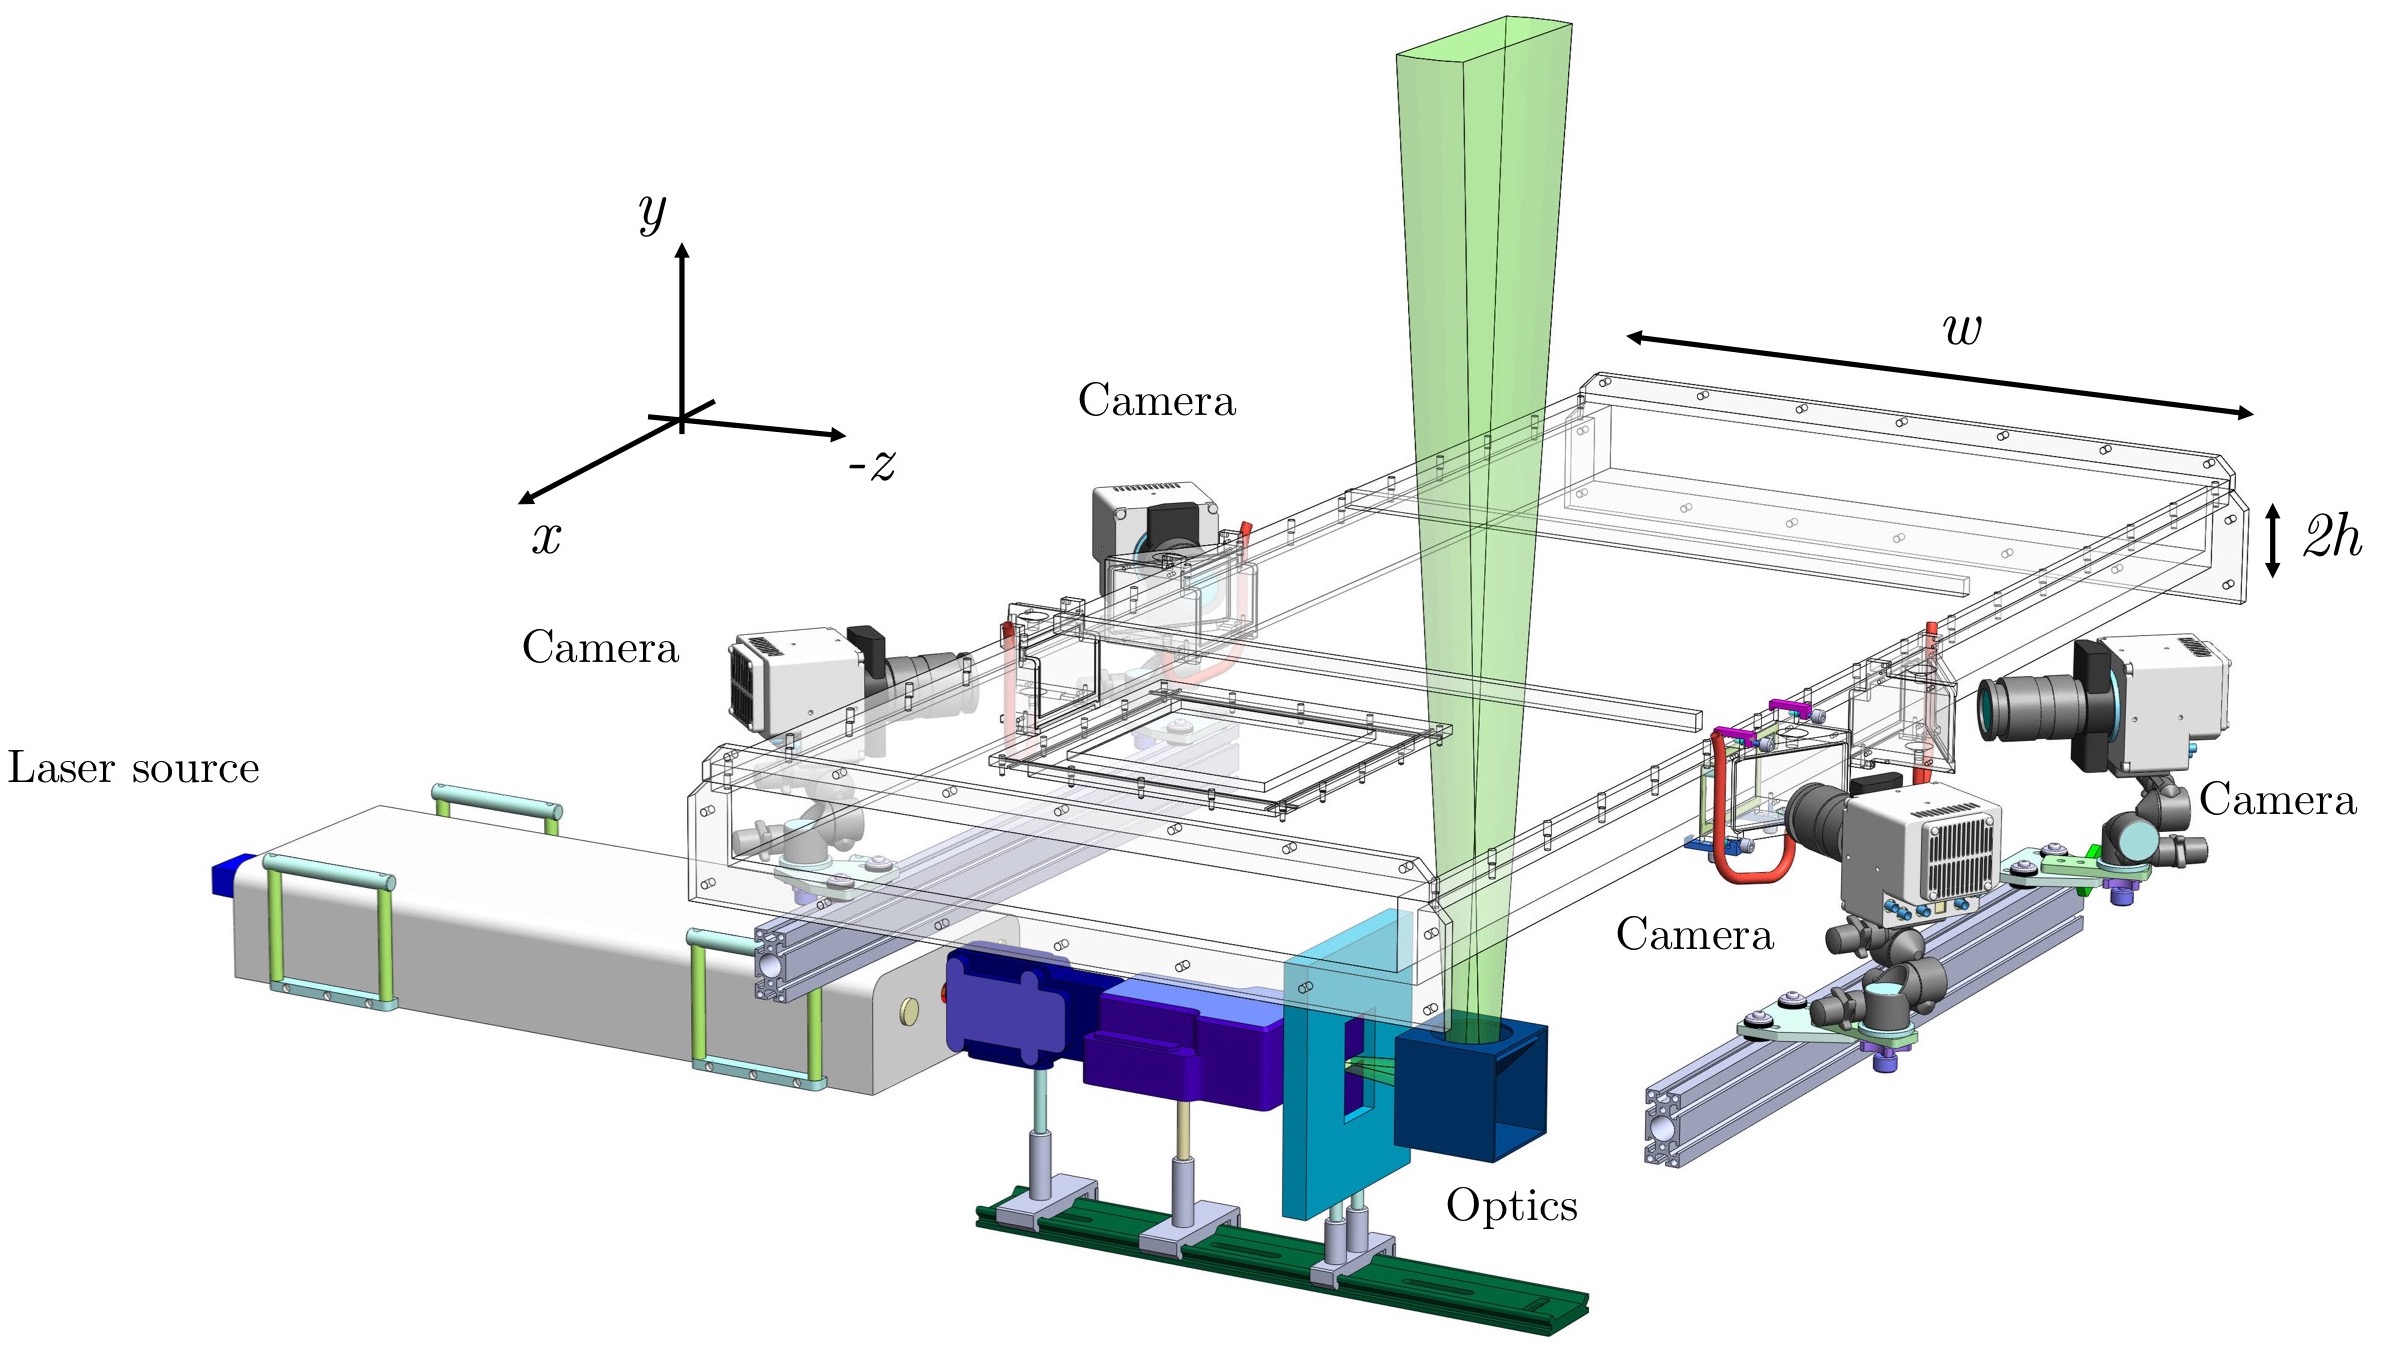
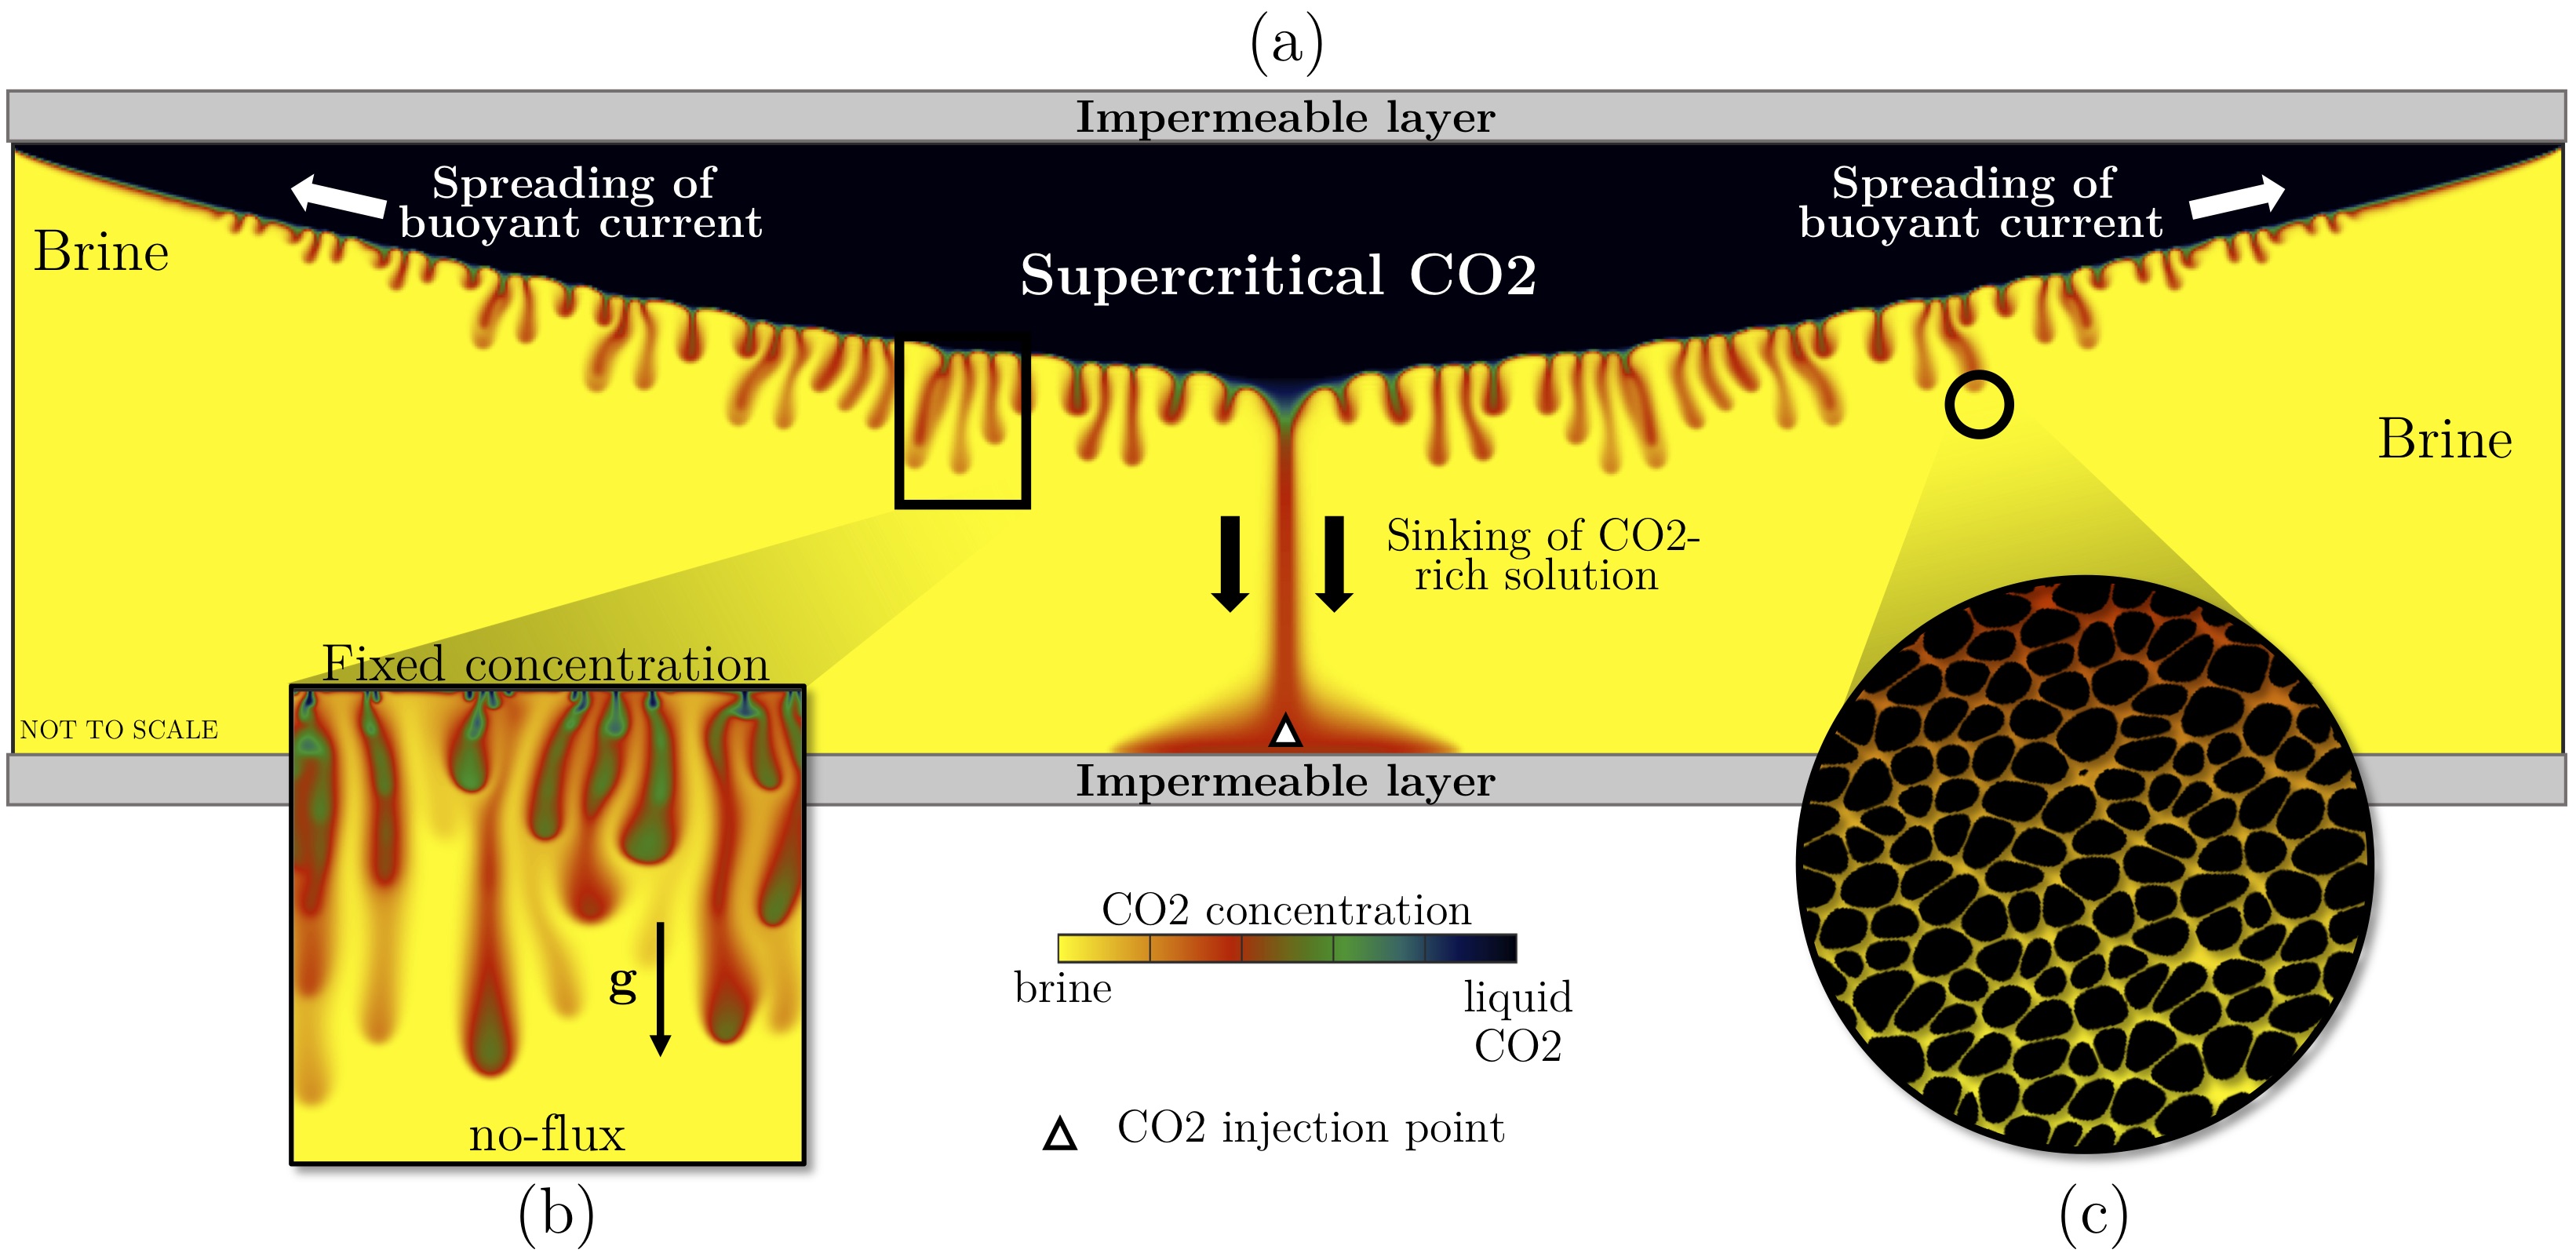
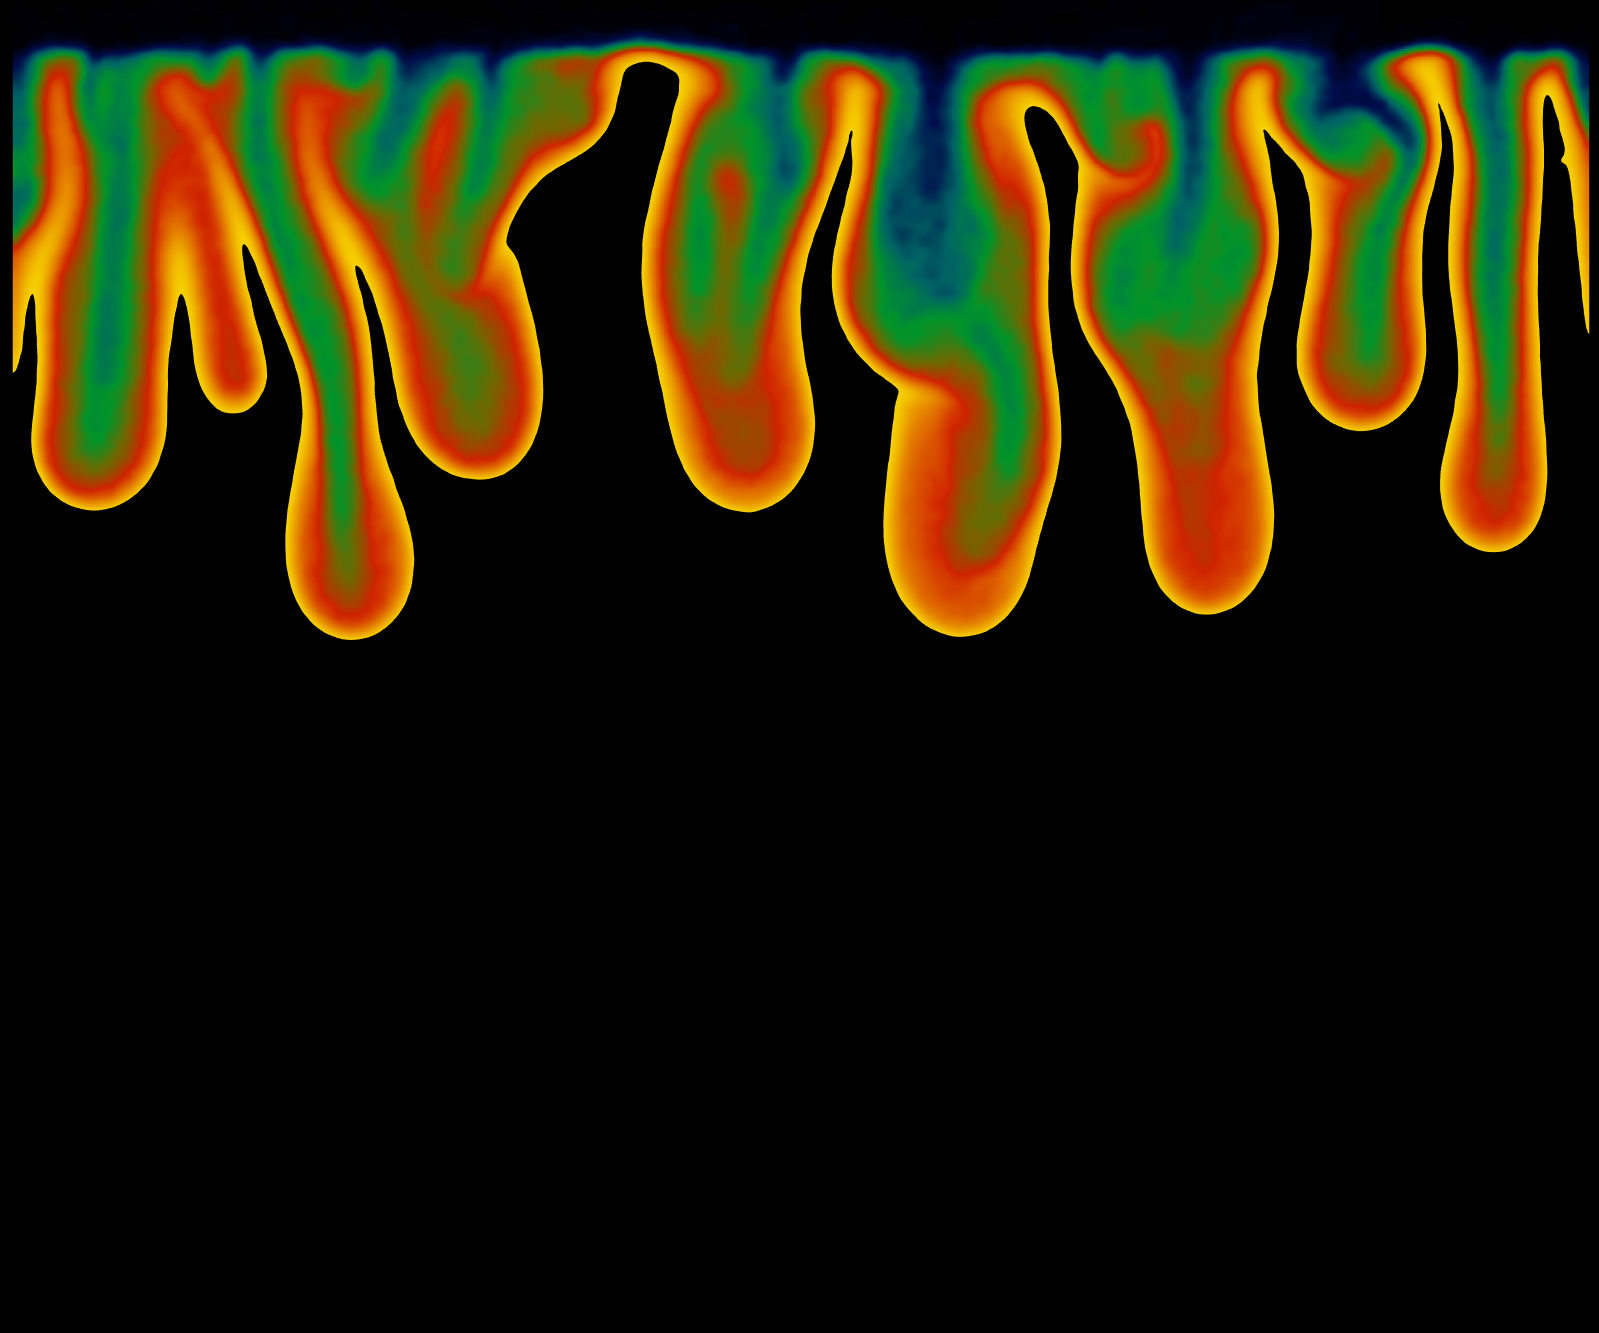
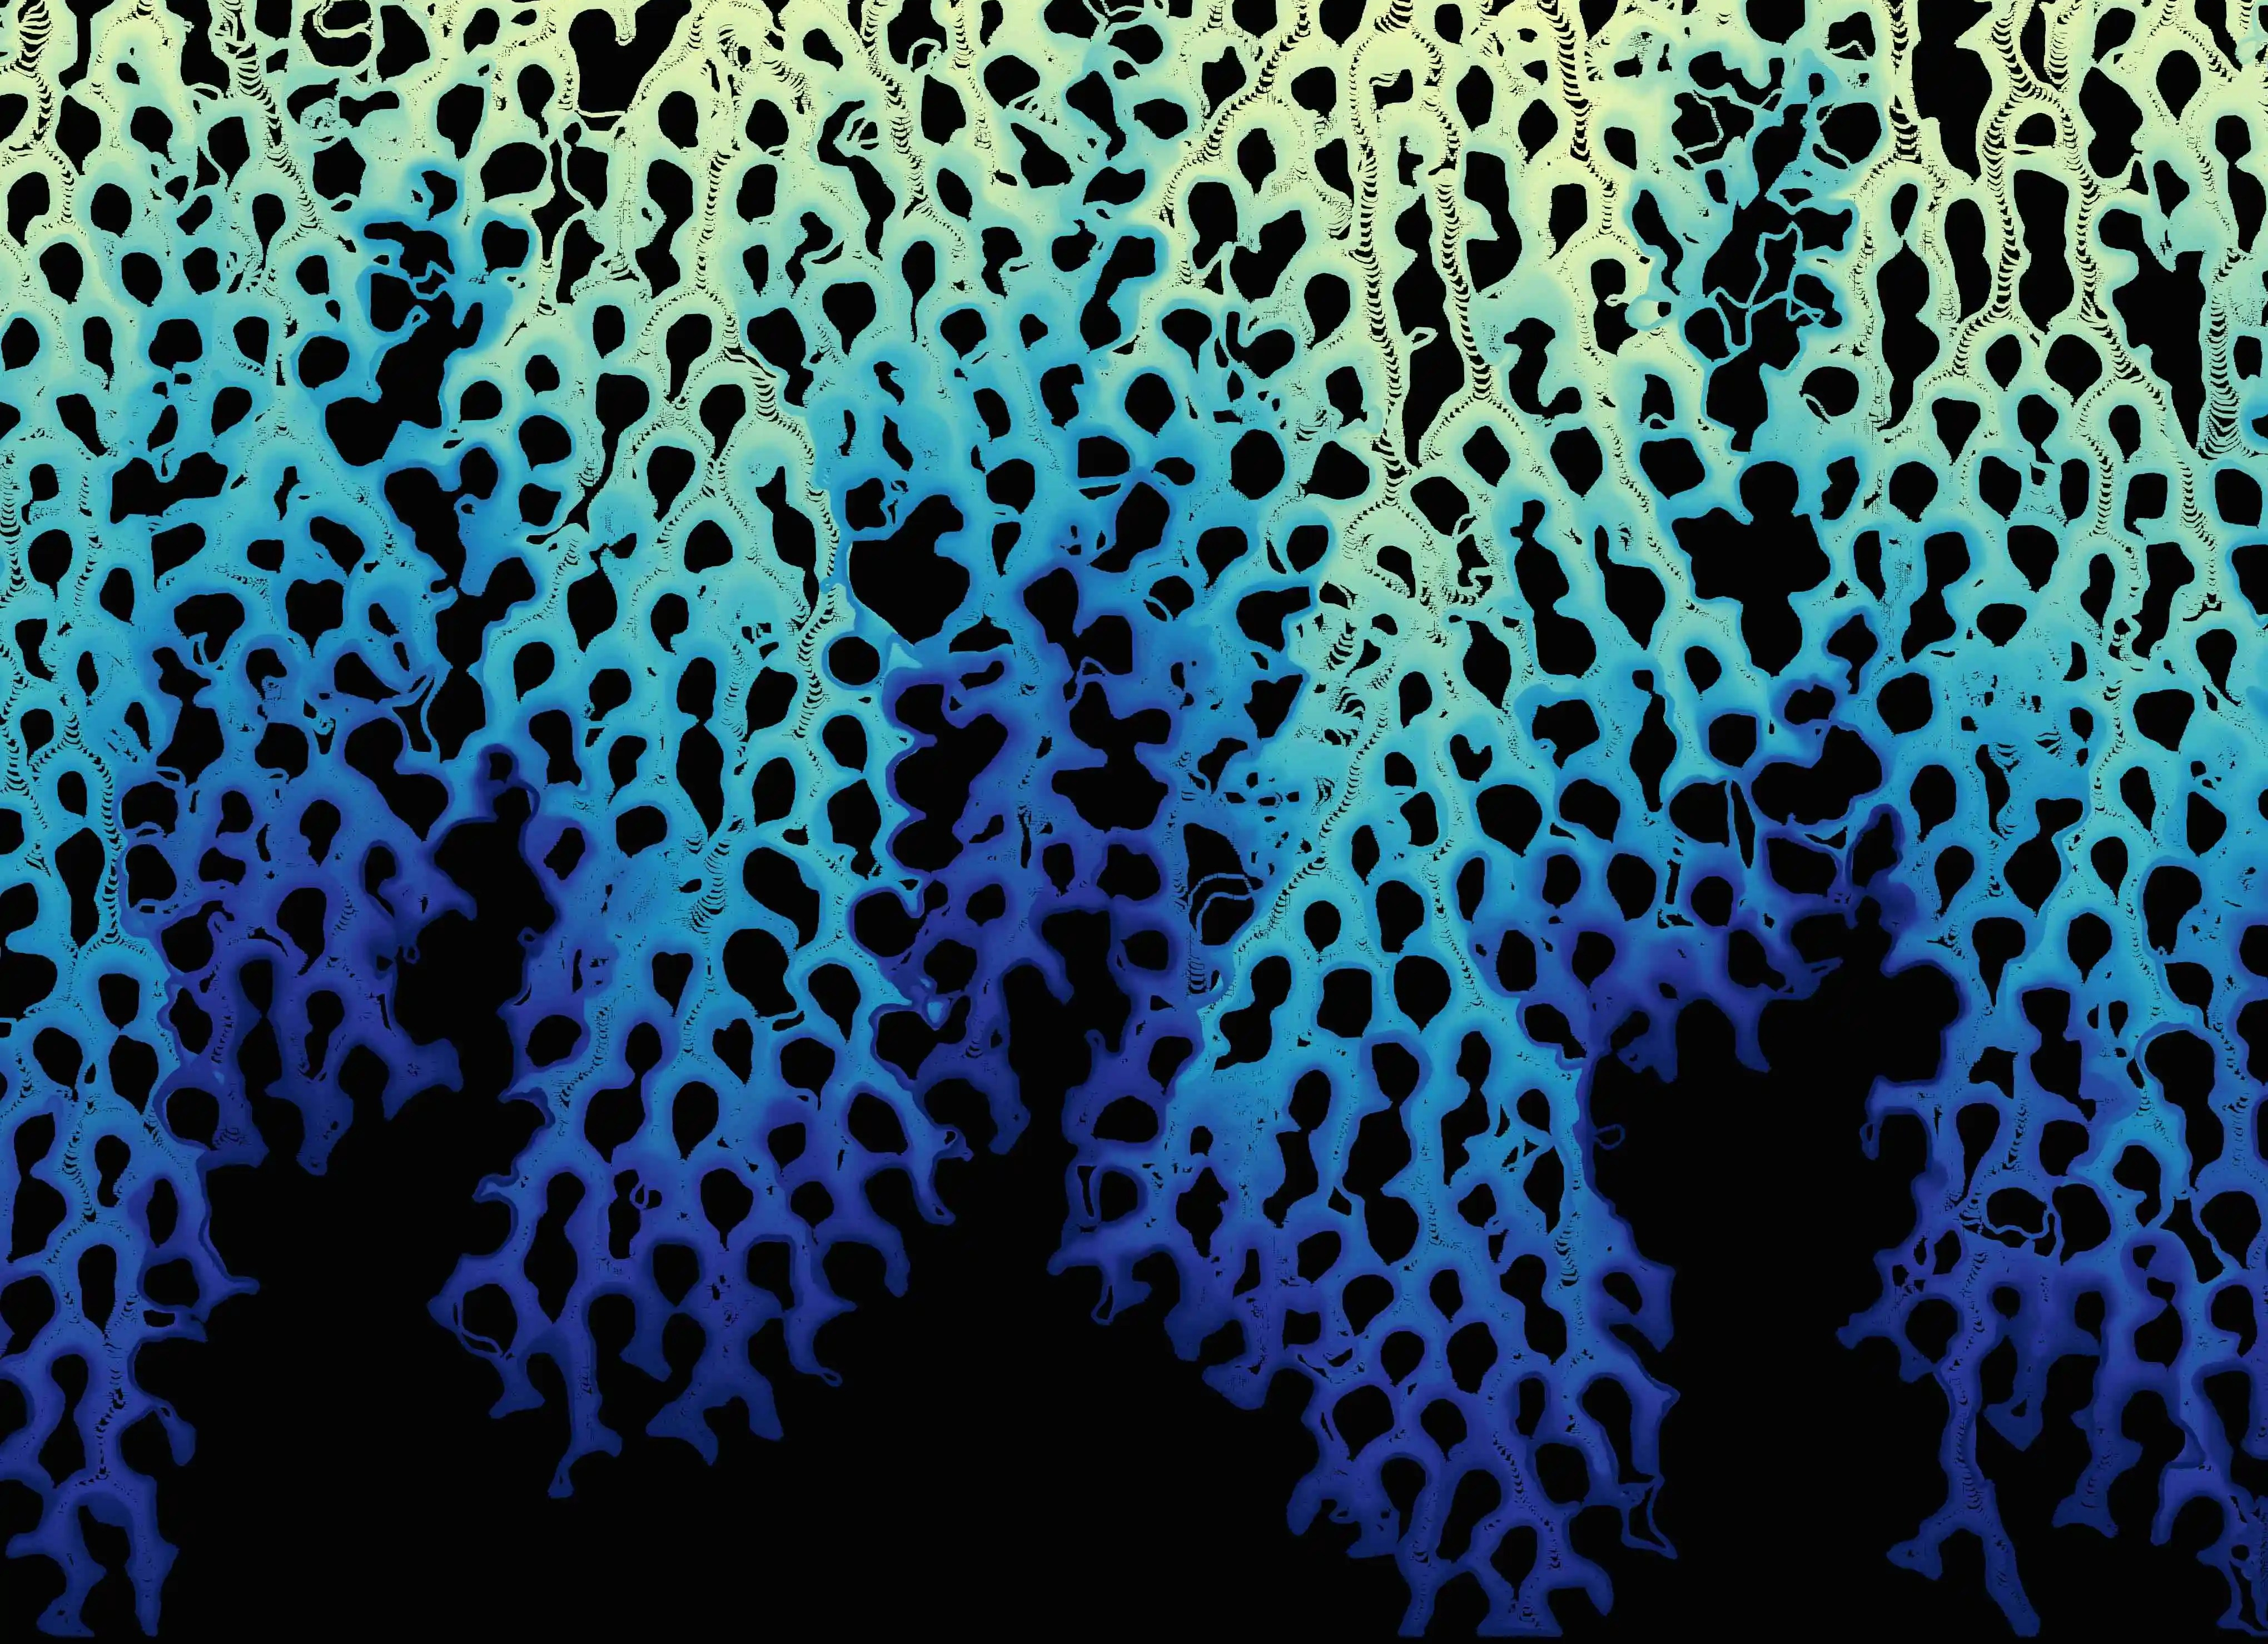
Pore-scale bouyancy-driven flow
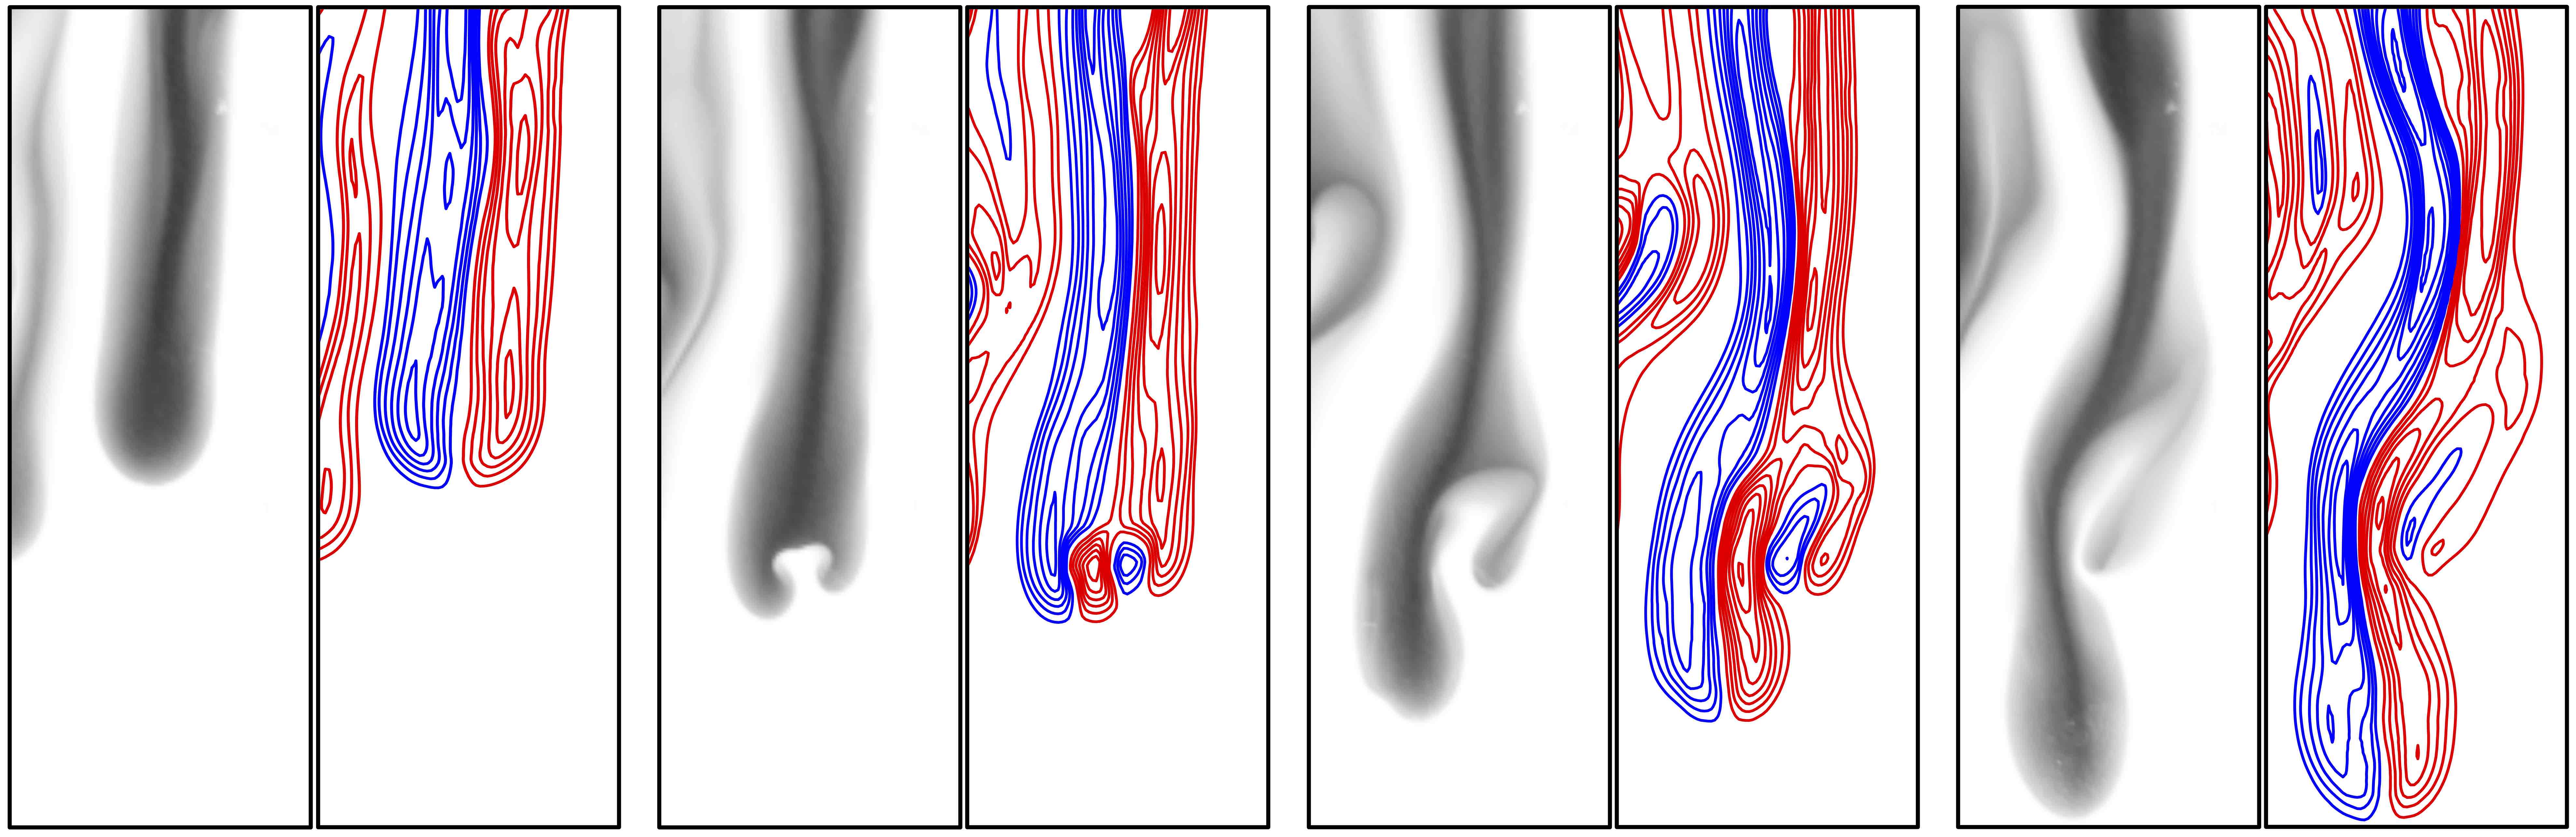
Rayleigh-Taylor instability in bead packs – experiments (De Paoli et al. , JFM , 2024 )
Rayleigh-Taylor instability in bead packs – simulations (De Paoli et al ., JFM , 2024 )
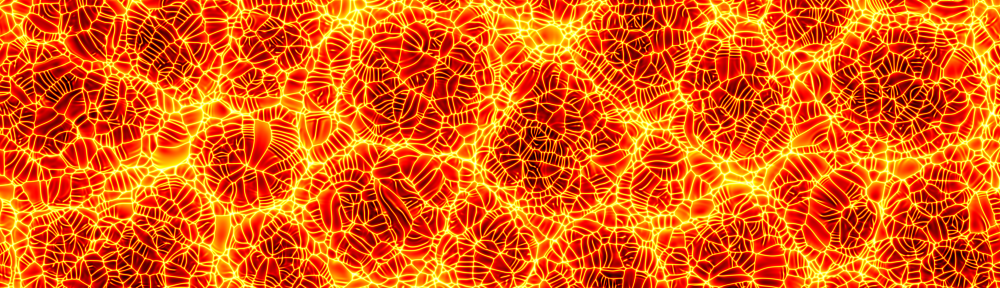
Temperature distribution in three-dimensional porous medium convection at high Rayleigh number.
Assessment of domains size effects on 3D Rayleigh-Darcy convection (De Paoli et al, JFM , 2022 )
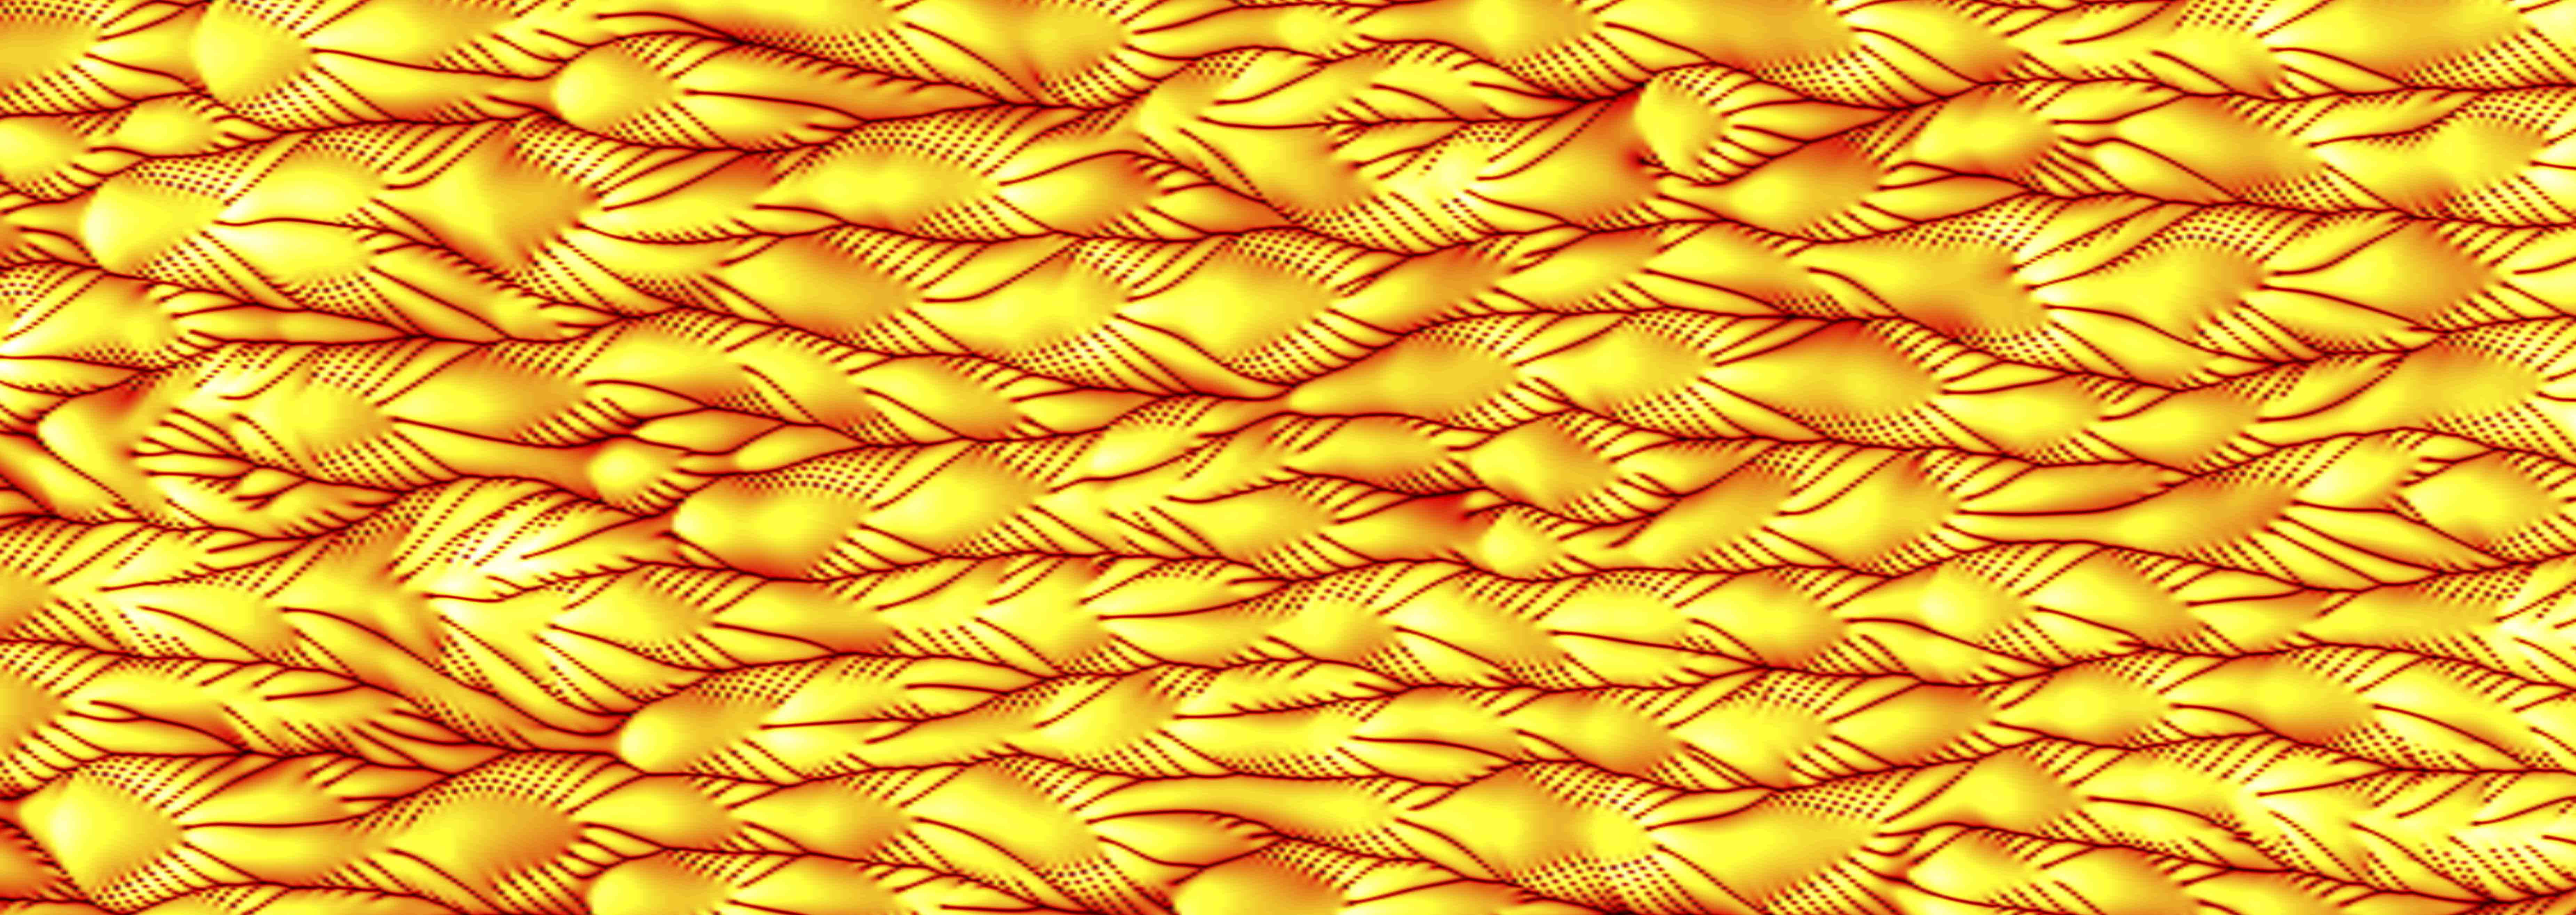
Tracking of curved and slender fibre in turbulent channel flow
The fibre (1.2 mm long) is coloured according to their tumbling (Alipour et al. , JFM, 2021 )
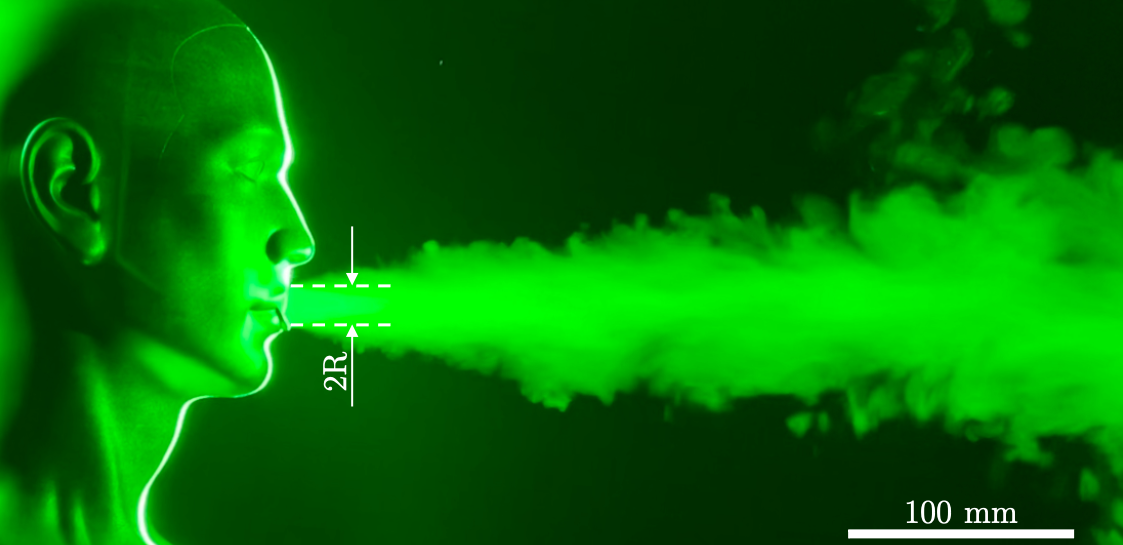
Analysis of virus exposure during a respiratory event
Experimental analysis of several protective devices (Wang et al. , PNAS , 2021 )
Visualisation of droplets size and distribution obtained via numerical simulations (Wang et al. , PNAS , 2021 )